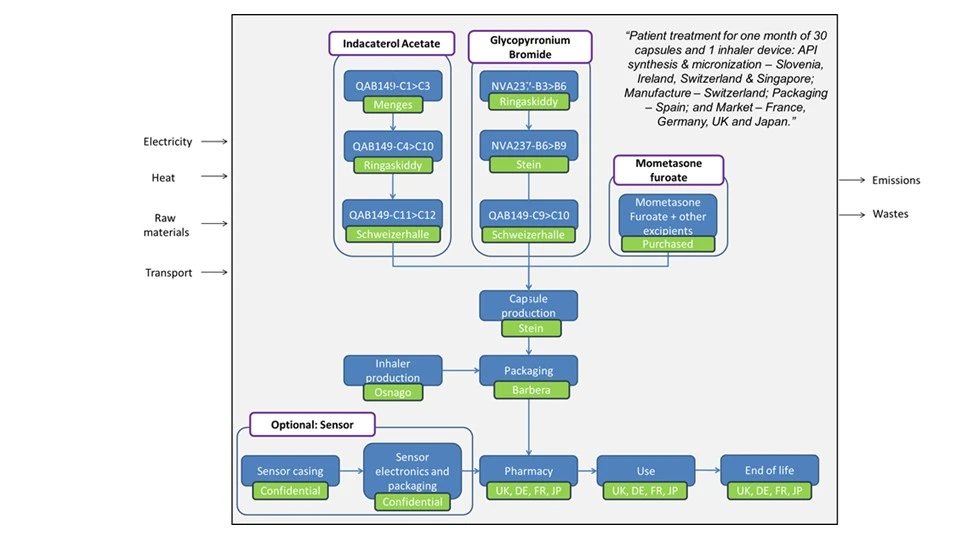
Life cycle assessment (LCA) studies of two BREEZHALER® inhaled products have been completed. One uses indacaterol acetate (IND) and mometasone furoate (MF) and the other uses IND, MF and glycopyrronium bromide (GLY). These studies have been carried out in accordance with the Greenhouse Gas Protocol Product Accounting and Reporting Standard 2011 Sector Guidance for Pharmaceuticals and Medical Devices (the GHG Protocol). The assessment included the whole product lifecycle including the device, Active Pharmaceutical Ingredients (API) and the optional Sensor**.
Scope
A cradle-to-grave assessment was completed so emissions were included from raw material production to consumer use and disposal (see figure 1).

Data Sources
Primary data were collected for all operations under Novartis’ direct control. In addition, primary data were sourced from the manufacturer of the sensor. In some cases, utilities data were difficult to obtain and approximations based on similar processes controlled by Novartis were used. For materials, the data sources are mainly technical activity data and bills of materials. Energy data were derived from financial data.
Footprint Results
A comparison of the carbon footprints for all products in all geographies is shown in figure 2 where the Functional Unit (FU) is defined as:
An inhaler device used for 30 days to treat a patient differentiated according to the characteristics of the market in France, Germany, UK or Japan.

The breakdown of the carbon footprints by life cycle stage in geographies is shown in figure 3.

The data for the French market on a monthly basis (30 days) is shown in figure 4 and on a daily basis in figure 5.


The life cycle carbon footprint for all products in the French market is shown in figure 6.

Assumptions
- Sensor production energy: Sensor production energy consumption is assumed to be 60% of that associated with the inhaler itself
- End of Life (EoL): A conservative approach has been taken with respect to EoL management with assumptions as follows:
| % incineration with energy recovery | % incineration without energy recovery | %landfill | |
|---|---|---|---|
| France | 60 | 40 | 0 |
| Germany | 100 | 0 | 0 |
| UK | 80 | 0 | 20 |
| Japan | 60 | 40 | 0 |
- Transport distances: These have been estimated by using actual distances between the respective production locations, which are: Menges; Ringaskiddy; Schweizerhalle; Singapore; Stein; Osnago; Barbera; and Paris. A 20 km distance is assumed from waste collection to end of life (EoL) management in each market and a 10 km distance was assumed for transport of waste from API production sites to a waste management facility